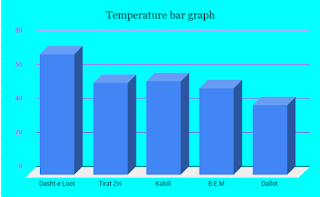
Hi welcome to my blog today I'm doing SLJ this activity is called burning up so how this works is I have to do a bar graph of temperatures in countries.
here is my bar graph of the temperatures in different countries.
Thank you.
BYE!!!
By Peyton.


Kia Ora Peyton,
ReplyDeleteWow, cool graph! I really like the colour scheme you have selected. Nice work completing this Summer Learning Journey activity, 'Burning Up...' These are some very hot cities. Could you imagine the temperature reaching 71oC here in New Zealand. Our climate definitely could not handle this temperature. Do you know any interesting facts about these cities listed in your bar graph?
I look forward to reading more of your great blog entries.
Thanks,
Jordan